Displaying the data
In order to display the data you will need to create a dashboard and a panel. A dashboard is a collection of panels. Each panel contains a specific query to display your data. You can also apply different customizations to the panel's appearance. However, the focus of this tutorial is to just display your newly ingested data. Bear in mind that the data you will display is a single point, if you have followed this tutorial. Displaying a single point is not very useful but the end goal is to learn how it works. So, later on when you create your real dashboard panels you have a good foundation to do so.
To create a new dashboard, from the sidebar, click on the Dashboards section. This will open the dashboards list. In the top right corner, click on New dashboard. Give it the name My test dashboard and the same value for Description.
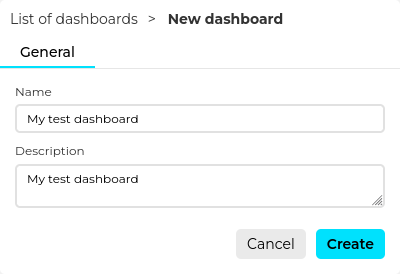
Click on create and now you have a dashboard. The dashboard alone is not really useful, so let us create a panel in it. On the dashboard list, click on the dashboard name. This will lead you to the dashboard view. On the top right corner, click on New panel. This will open a dropdown with the panel type options you can choose. For the purpose of this tutorial, select Time series.
Once you are in the panel creation page you will see on the left the panel basic information form, such as Name and Description. Fill both fields with My test panel value. To the right, you will have the query builder. The query builder will allow you to define what the panel should display. Configure the query builder with the following settings:
Query 1
- Name: Humidity Mean
- Select device: My test device
- Select message type: My test message type
- Select attribute: humidity
- Select aggregation method: Mean
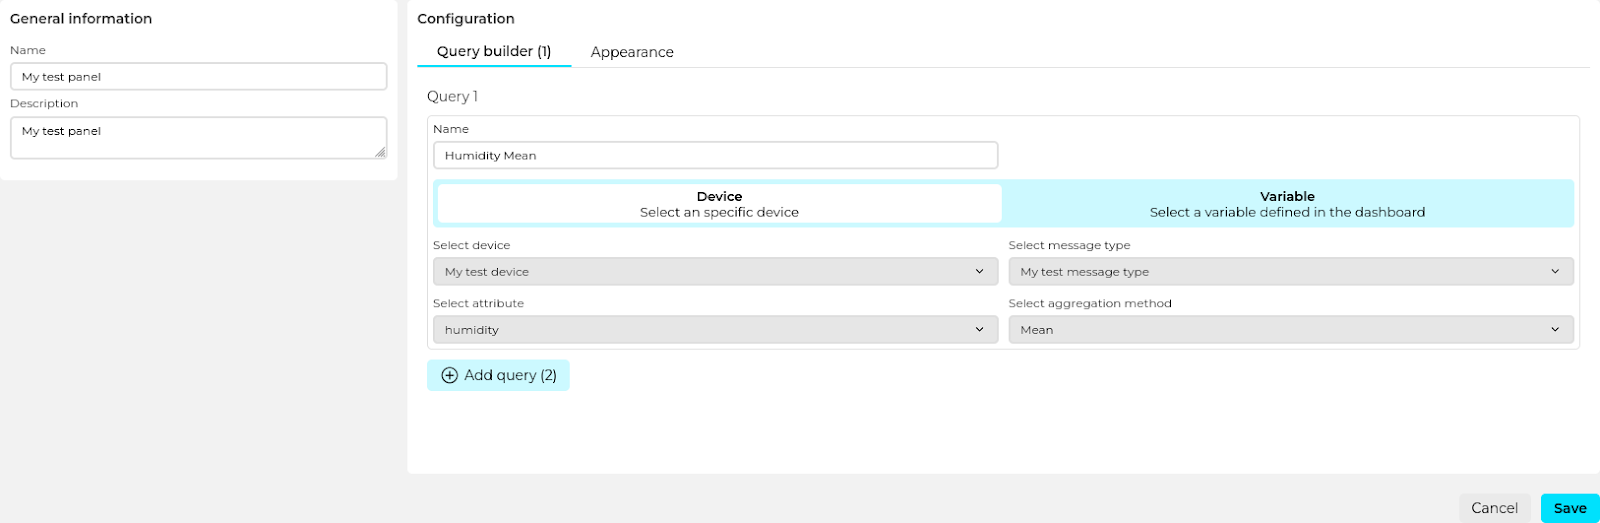
You can also change the appearance of the panel but that is out of the scope for this tutorial. As you can see, you can also add more queries to the panel but in this tutorial we want to make it simple and go with just a single query.
Once you fill the query builder with the details above click on Save. This will create the panel and it should display a single data point in your.

If it says “No data to show” please make sure the time filter, found in the top right toolbar, is set to a smaller time range, for example 30 minutes.
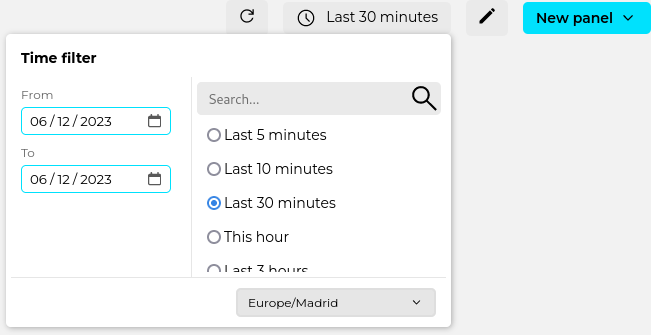
If everything is correct, you should see the data point you just sent to the platform a few minutes ago.
Congratulations!